Online Candlestick Chart Generator, Convert JPG to PDF
As it is in the field of finance and trading a precise visualization of data is important since it assists in making informed decisions. One of the most commonly used techniques to exhibit financial data is through candlestick charts especially when it comes to price movement of assets over time. These charts make market fluctuations clear and concise enabling traders and analysts to identify trends, patterns, and behavior.
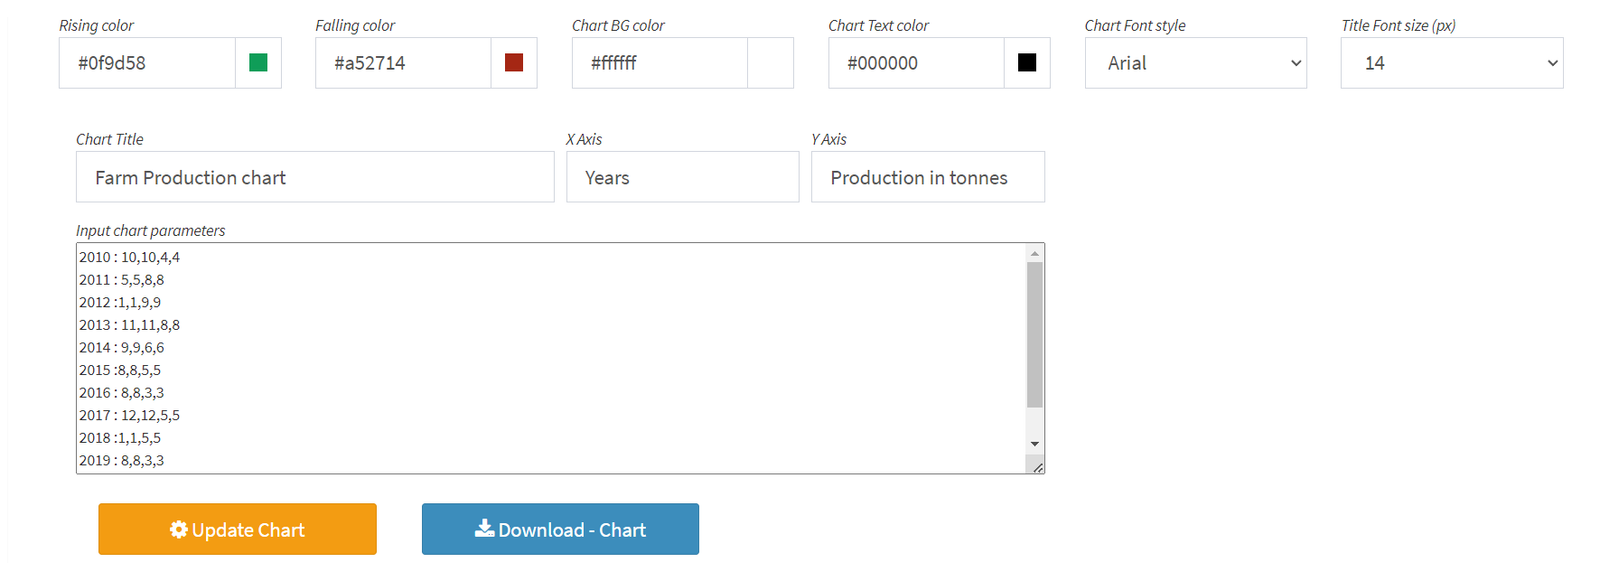
The Online Candlestick Chart Maker Tool from convertjpgtopdf.net provides a solution for generating such charts easily and quickly. With this tool, users can create high-quality candlestick charts that are fully customizable as well as exportable into PDF documents be they stock prices you follow, values of cryptocurrency or even rates for commodities.
This article will discuss about the features and benefits of the Online Candlestick Chart Maker Tool, how to use it and how it can help you with your data visualization needs.
What is a Candlestick Chart and Why Use It?
A candlestick chart is a kind of financial graph that shows price changes over time for a certain asset. Every “candle” generally signifies a given time period (for example, one minute, an hour, one day, one week or even one month), offering four main data points for that moment:
- Open: The cost at which an asset was bought or sold at the start of this duration.
- Close: The price at which the asset was bought or sold at the end of this period.
- High: This is the highest cost realized within the time frame.
- Low: This is the lowest rate achieved in that duration.
Candlestick charts are very common in trading especially stock markets, cryptocurrency markets as well as commodities trading for a number of justifications:
- Clearness: They provide traders with an easy but complete visual representation of prices actions such as trends emergence, reversals and volatilities.
- Pattern Recognition: Candlestick charts are particularly useful in identifying common chart patterns such as doji, engulfing and hammer patterns which can indicate possible market moves.
- Time-Based Analysis: With these charts, one is able to conduct an extensive time-based analysis that allows traders to see how the price of a security has changed over various periods.
With the online candlestick chart maker tool from convertjpgtopdf.net, users can easily generate candlestick charts and analyze financial data without having to use specialized software or have expertise on it.
How Does the Online Candlestick Chart Maker Tool Work?
The design of convertjpgtopdf.net’s online candlestick chart maker tool is simple. Below is a guide on how it works:
Input Your Data
Now you’ll need to input your financial information into the tool. This could be done by:
- Manually Entering Data: Enter the opening, closing, high and low prices for each time period you want plotted.
- Uploading a CSV File: If you have large datasets, you can upload a CSV file that contains price data for multiple time periods. This spares a lot of time if there are tons of data involved.
Customize and Personalize Your Candlestick Chart
When the data is entered, there are many customization options offered by this tool to tailor your chart:
- Time interval: Select the time interval for each candlestick E.g., daily, hourly or minute based.
- Customizing colors: For bullish (up) and bearish (down) candlesticks, one can choose the best colors which are mainly green color up and red color down usually used by many traders for clearness.
- Chart Layout: Choose a layout that suits you with width, height of chart and margins that are adjustable.
- Make the chart easier to read with customized gridlines or without any at all.
- Some tools also allow you to overlay technical indicators like moving averages, Bollinger Bands, or RSI (Relative Strength Index) for more detailed analysis.
Generate the Candlestick Chart
Click on “generate” button after customizing your chart. The tool will process your data and create the candlestick chart according to the settings you have selected. You will see an immediate change in the graph as it updates live in regards to your information source.
Export the Chart to PDF
If you like the chart, it is easy to convert it into a PDF. The page size, orientation, and margins of the PDF output can be adjusted using the Online Candlestick Chart Maker Tool.
Download the PDF
After your chart has been converted, you will be able to download a PDF document with your candlestick chart. It is ready for sharing, printing and being included in reports.
Key Features of the Online Candlestick Chart Maker Tool
The online tool called “Online Candlestick Chart Maker Tool” by convertjpgtopdf.net has different functionalities which are aimed at facilitating making financial charts:
- User-Friendly Interface: A beginner can input data and customize charts quickly without any technical knowledge.
- Customizable Time Intervals: You can choose time periods for candlesticks from minutes to weeks or even months.
- Color Customization: The colors for upward or downward price changes on candlesticks can easily be changed.
- Overlay Indicators: Other technical indicators such as moving averages and RSI may also be added for more detailed analysis.
- High-Quality PDF Output: When you have completed your chart, you may export it into high-quality format like PDF suitable for sharing or printing.
- Zero Software Installation: It is a web-based tool; hence no software installation is necessary to kick-start chart creation.
Uses of the Online Candlestick Chart Maker Tool
Online Candlestick Chart Maker Tool could be suitable for stockbrokers, fiscal analysts, and any other person dealing with market information. Some examples are:
- Stock Market Analysis: By using candlestick charts traders can review past prices on the stock market in order to identify possible trading signals.
- Cryptocurrency Trading: Cryptocurrency dealers will make use of candlestick charts to follow trends in digital currencies such as Bitcoin, Ethereum among others which tend to be very volatile.
- Commodity Trading: In commodities trading, including gold, oil and agricultural products; candlestick charts have become widely used for monitoring market trends and making good decisions.
- Financial Reporting: The highlighting of price movements and market trends over a given period in financial reports is done by employing candlestick charts by analysts and investors.
- Technical Analysis: Technical analysis relies heavily on candlesticks which help traders identify patterns that indicate future market behavior like bearish and bullish trends.
The tool assists anyone who wants to visualize price data over time and produce professional reports that can be shared.
Why select the online convertjpgtopdf.net candlestick chart maker?
Numerous tools for creating charts exist, however, the Online Candlestick Chart Maker Tool from convertjpgtopdf.net provides a number of important benefits:
- User-Friendly: A simple and intuitive interface makes it possible even for novices to create good looking candlestick charts without any specialized software.
- Fast Loading Data: This tool allows you to upload CSV files which enable users to work with large amounts of data quickly.
- High Quality Charts: The graphs are of high quality making them ideal for official presentations or financial reports
- Internet Based Application: There is no need for software installation as it is completely web based. Additionally, there’s no worry about device compatibility because it can be used on all mediums through internet connectivity.
- Free Cost Option: As opposed to other charting tools, this one is free hence providing great value for people who want to visualize their monetary information.
Do’s For Effective Candlestick Charts
For you to get more out of the Online Candlestick Chart Maker Tool do the following:
- Select your Candles’ Time frame Wisely: The time frame you choose for your candlesticks will depend on what kind of analysis you are performing. If you are going to trade on short-term basis then minute-based intervals would be ideal whereas longer term trend analysis may require daily/weekly time intervals.
- Use Colors Economically: Many traders prefer to use green for bullish candlesticks and red for bearish ones, but you can choose your own colors if you want or even better, select colors which will match with the color scheme of your presentation.
- Indicate for Deeper Analysis: Overlay technical indicators such as moving averages or Bollinger Bands to get a more detailed view of price trends.
- Avoid Data Overload: Refrain from cluttering the chart with too many data points. Concentrate on specific time frames showing major price actions or inclinations.
- Check and Adjust: Always inspect your chart before exporting. Verify that axes, labels, and titles are clear and data accurately depicted.
FAQ
How do I fill in the candlestick chart maker tool with data?
Data can be entered manually or a file with CSV format containing all financial details is uploaded (open, close, high and low prices per time period).
Is it possible to alter an interval between each candlestick?
Yes, that is right; you can adjust the interval between each candlestick whereby it could be one minute or take days or even weeks as preferred by the user.
Does it have any charges?
Absolutely! The Online Candlestick Chart Maker Tool is completely free.
Can I use technical indicators on my candlestick chart?
Yes, we have the tool that allows you to incorporate technical indicators such as Exponential Moving Averages (EMA), Relative Strength Index (RSI) and others to improve your analysis.
How do I export the graph to PDF?
After creating a graph, it is easy to convert it into a pdf format by clicking on “Export to PDF” button and downloading it.
Do I need to sign up for this tool?
No, you are able to utilize the Online Candlestick Chart Maker Tool with no necessity of having an account or signing up.
Conclusion
convertjpgtopdf.net’s Online Candlestick Chart Maker Tool is an effective but simple utility for making candlestick charts from financial information. Through its simple-to-use interface, customizable elements and high-resolution outputs; it presents itself as an efficient way of viewing market data, tracking trends and sharing ideas. Therefore, whether one is a trader or financial analyst or he/she has general interest in how markets behave; this program will enable him/her create professional candlestick graphs.